You finish a set of five, rack the bar, and your program says “top set of 5 at RPE 8.” Was that an 8? Could you have done two more reps, or was the last one already a grind? That one number decides whether today’s session builds strength or just builds fatigue, so it is worth getting right.
An RPE chart turns that feeling into something you can load on the bar. It links the reps you did and how hard they felt to a percentage of your one rep max. Below you will find an RPE calculator, the full chart for 1 to 10 reps, a worked example with real numbers, and the honest limits of rating your own effort. If you already know your max and just want training weights, the one rep max calculator on our homepage does that in one step.
RPE Calculator
Enter a recent set and how hard it felt. You get an estimated one rep max, plus a suggested weight for whatever reps and RPE your next session calls for. Weight liftedUnitlbskgReps completed12345678910RPE of that set109.598.587.576.56
Plan your next setTarget reps12345678910Target RPE109.598.587.576.56Calculate
What RPE Actually Means in Lifting
RPE stands for rate of perceived exertion. The version lifters use today is tied to reps in reserve (RIR): how many more clean reps you could have done before failing. That link was laid out in a 2016 paper by Helms and colleagues in the Strength and Conditioning Journal, and it is the reason the scale works. You are not guessing at “how tired do I feel,” you are counting reps you left behind.
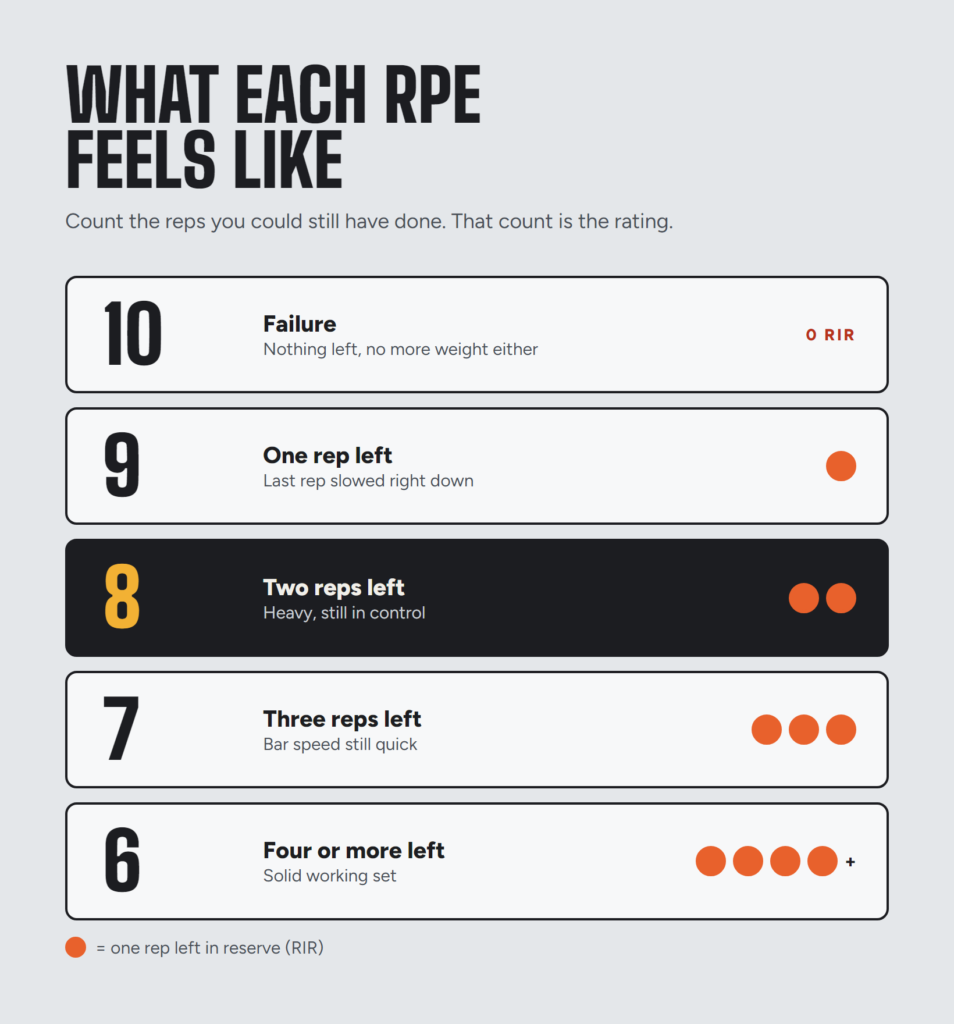
| RPE | Reps in reserve | What it feels like |
|---|---|---|
| 10 | 0 | Max effort. No more reps possible. |
| 9.5 | 0 to 1 | No more reps, but you might have managed a touch more weight. |
| 9 | 1 | One rep left, for sure. |
| 8.5 | 1 to 2 | Definitely one more, maybe two. |
| 8 | 2 | Two reps left. |
| 7.5 | 2 to 3 | Two more for sure, maybe three. |
| 7 | 3 | Three reps left. Bar speed still quick. |
| 6 to 6.5 | 3 to 4+ | Comfortable working set. |
| Below 6 | 5+ | Warm-up territory. |
Most strength programs live between RPE 7 and 9. That range is heavy enough to drive progress and far enough from failure that you can recover and do it again in a few days.
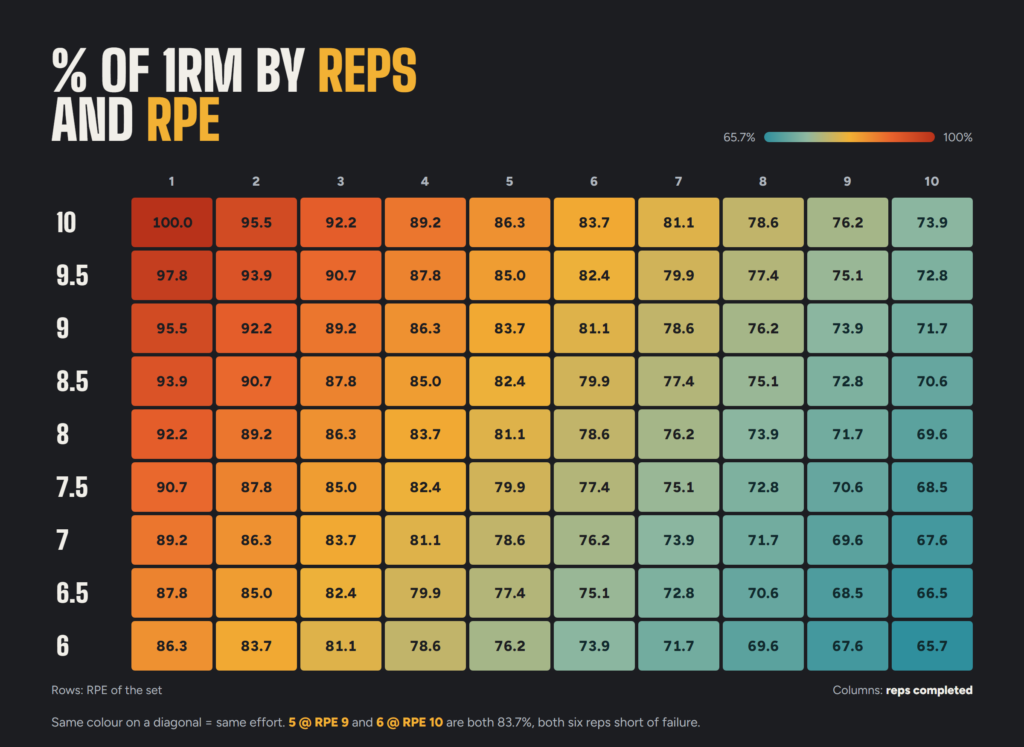
RPE Chart: Percentage of 1RM by Reps and RPE
This is the widely used chart popularised by powerlifting coach Mike Tuchscherer of Reactive Training Systems. Find your reps across the top and your RPE down the side. The cell is the percentage of your one rep max that set represents.
| RPE | 1 | 2 | 3 | 4 | 5 | 6 | 7 | 8 | 9 | 10 |
|---|---|---|---|---|---|---|---|---|---|---|
| 10 | 100% | 95.5% | 92.2% | 89.2% | 86.3% | 83.7% | 81.1% | 78.6% | 76.2% | 73.9% |
| 9.5 | 97.8% | 93.9% | 90.7% | 87.8% | 85.0% | 82.4% | 79.9% | 77.4% | 75.1% | 72.8% |
| 9 | 95.5% | 92.2% | 89.2% | 86.3% | 83.7% | 81.1% | 78.6% | 76.2% | 73.9% | 71.7% |
| 8.5 | 93.9% | 90.7% | 87.8% | 85.0% | 82.4% | 79.9% | 77.4% | 75.1% | 72.8% | 70.6% |
| 8 | 92.2% | 89.2% | 86.3% | 83.7% | 81.1% | 78.6% | 76.2% | 73.9% | 71.7% | 69.6% |
| 7.5 | 90.7% | 87.8% | 85.0% | 82.4% | 79.9% | 77.4% | 75.1% | 72.8% | 70.6% | 68.5% |
| 7 | 89.2% | 86.3% | 83.7% | 81.1% | 78.6% | 76.2% | 73.9% | 71.7% | 69.6% | 67.6% |
| 6.5 | 87.8% | 85.0% | 82.4% | 79.9% | 77.4% | 75.1% | 72.8% | 70.6% | 68.5% | 66.5% |
| 6 | 86.3% | 83.7% | 81.1% | 78.6% | 76.2% | 73.9% | 71.7% | 69.6% | 67.6% | 65.7% |
Notice the pattern. Moving half a point down the RPE scale does the same thing as adding half a rep. 5 reps at RPE 9 and 6 reps at RPE 10 are both 83.7%, because in both cases you were six reps from failure. Once that clicks, the chart stops looking like a wall of numbers.
You will see slightly different numbers on other RPE calculators, because some build their chart from a formula like Epley instead. Differences of 1 to 3 percent are normal, and our guide to the best one rep max formula explains why formulas disagree.
How to Use the RPE Chart: A Worked Example
Say you bench 225 lbs for 5 reps and it felt like an RPE 8, two good reps left.
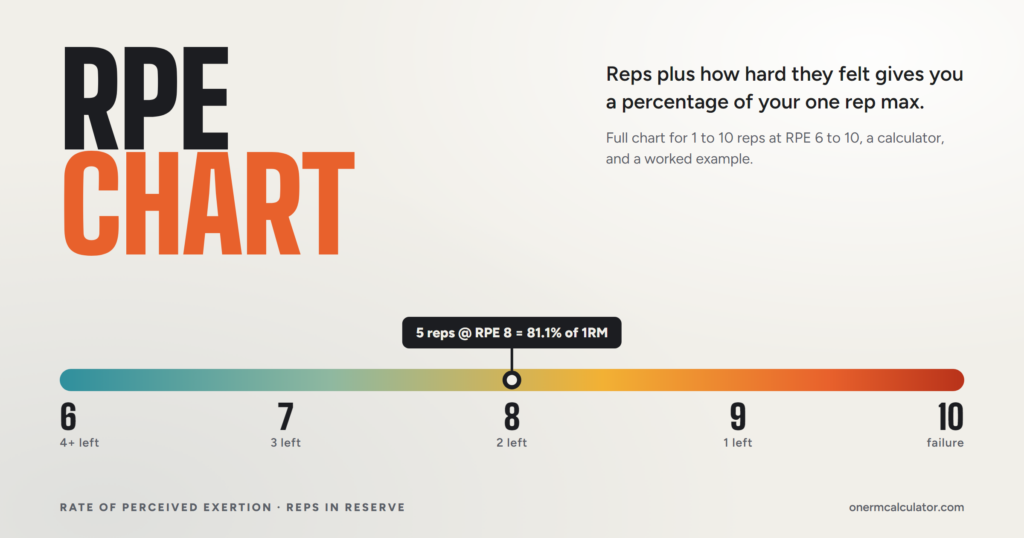
- Find the percentage. 5 reps at RPE 8 is 81.1%.
- Estimate your max. 225 divided by 0.811 is about 277 lbs. That is your estimated 1RM for today.
- Plan the next set. Your program asks for 3 reps at RPE 8. The chart says 86.3%. 277 times 0.863 is about 239, so load 240 lbs.
The same logic works for squats and deadlifts. For bench and squat specifically, you can cross-check the result against our max bench press calculator and squat calculator.
RPE vs Percentage-Based Training
Percentage programs tell you to lift a fixed number, like 80% of your max. RPE tells you to lift whatever weight produces a set effort today. The difference shows up on bad days. Slept four hours? A fixed 80% might feel like a 9.5. With RPE, you drop the weight and still get the right training stimulus.
| Factor | Percentage-based | RPE-based |
|---|---|---|
| What sets the load | A fixed % of a tested or estimated max | How hard the set feels on the day |
| Handles bad days | No, the number stays the same | Yes, load adjusts automatically |
| Needs an accurate 1RM | Yes | No, it estimates one as you go |
| Learning curve | Low | Higher, you have to learn to rate sets |
| Best for | Beginners, simple linear programs | Intermediate and advanced lifters |
Does it actually lead to better results? A 2018 eight-week study in Frontiers in Physiology compared the two in 21 trained men. Squat strength rose 17.1 kg in the RPE group versus 13.9 kg in the percentage group, and bench rose 10.7 kg versus 9.6 kg. The differences were not statistically significant, and muscle growth was similar. So RPE is not magic, but it is at least as good, with a small edge in strength.
A good middle ground is to run percentages off a slightly reduced max. We cover that approach in training max vs one rep max.
Why Your RPE Ratings Will Be Off at First
Here is the catch nobody mentions on the chart itself: the chart is only as good as your rating. Research on the RIR scale, including a 2016 study by Zourdos and colleagues, found experienced lifters rated their effort more accurately than novices, and that ratings got more accurate on heavier sets closer to failure. New lifters tend to underestimate how many reps they have left, so a set they call RPE 9 is often really a 7.
Ways to calibrate faster:
- Rate the set right after you rack it, before you sit down and the feeling fades.
- Use sets of 1 to 6 reps to learn. Past about 10 reps, breathing and burning muscles blur the signal.
- Film your top sets. A sharp drop in bar speed on the last rep usually means you were at RPE 9 or higher.
- Test yourself occasionally. On a safe lift like the leg press, call your RPE, then keep going to see how many reps were actually left.
- Warm up the same way every time so the rating is comparable from week to week. Our how to warm up for 1rm guide has a simple template.
When Not to Use an RPE Chart
- Your first few months of lifting. Just add weight every session while you can. See where you stand with our beginner vs intermediate vs advanced lifters breakdown.
- Sets above 10 to 12 reps. The chart gets unreliable once endurance, not strength, is what stops you.
- Estimating a competition max. A chart gives a planning number, not a guarantee. Read are one rep max calculators accurate before trusting any estimate with a meet attempt.
This article is general training information, not medical advice. Lift with a spotter or safeties when working near RPE 9 to 10, and stop if you feel pain.
Frequently Asked Questions
What does RPE 8 mean in lifting?
RPE 8 means you finished the set with about two good reps left before failure. It is heavy but controlled, and it is the most common target in strength programs.
What percentage is RPE 8?
It depends on the reps. On the standard RPE chart, 1 rep at RPE 8 is 92.2% of your one rep max, 3 reps is 86.3%, 5 reps is 81.1%, and 8 reps is 73.9%.
How do I calculate my 1RM from RPE?
Find the percentage for your reps and RPE on the chart, then divide the weight you lifted by that percentage. For example, 225 lbs for 5 reps at RPE 8 is 81.1%, so 225 divided by 0.811 gives an estimated 1RM of about 277 lbs.
Is RPE 10 the same as failure?
Yes. RPE 10 means zero reps in reserve: you could not have done another rep, and you could not have added weight either.
What is the difference between RPE and RIR?
RIR counts reps in reserve, and RPE is the 1 to 10 score built on top of it. RPE 10 equals 0 RIR, RPE 9 equals 1 RIR, RPE 8 equals 2 RIR, and so on.
Is RPE training good for beginners?
Usually not at first. Beginners tend to misjudge how many reps they have left, so a simple program that adds weight each session works better for the first few months. Start rating sets early for practice, but load the bar by the plan.
Is RPE better than percentage-based training?
Research suggests it is at least as good. A 2018 study found slightly larger strength gains with RPE-based loading, but the difference was not statistically significant. RPE’s main advantage is that it adjusts to good and bad days.
Why do different RPE charts give different numbers?
Some charts are built from coaching data and others from formulas like Epley or Brzycki. Differences of 1 to 3 percent between charts are normal, and your own numbers may differ slightly from any chart.
Final Thoughts
An RPE chart is a translator. It turns “that felt like two reps left” into a number you can load on the bar, and it lets your training weight move with your recovery instead of fighting it. Use the calculator above to get today’s estimate, keep your ratings honest, and retest your max every so often. Our guide on how often should you test your one rep max covers when that makes sense.